Paths after high school
Apprenticeship vs college: costs, pay and benefits
Neither is better for everyone. A registered apprenticeship is a paid job with classroom instruction, so you earn while you train instead of paying tuition. College charges tuition and leads to degree-based careers. GAO reports that apprenticeship completers averaged about $80,000 in their first year after exiting (2025), an average for completers, not a salary to expect.
By Pathfinder Editorial · Published · Updated · 12 min read
About: Trade and apprenticeship Registered apprenticeship University

Neither apprenticeship nor college is "better" in the abstract. The useful question is what each route pays, what it costs, and who the averages describe. This article puts the official US figures side by side — apprentice numbers and wages (CRS, GAO), skilled-trade wages (BLS), college costs (NCES, College Board) and earnings by education (BLS). Every figure is dated.
These are US national figures. Pathfinder ships country packs for the United States, the United Kingdom, the United Arab Emirates, India and Singapore, so the questions below travel — the numbers do not.
What is a registered apprenticeship?
A registered apprenticeship is a paid job with structured on-the-job learning under a mentor, related classroom instruction, progressive wage increases and a portable, nationally recognised credential at the end. That is the U.S. Department of Labor's own description of the model on apprenticeship.gov, which lists the components as an industry-led programme, a paid job, structured on-the-job learning and mentorship, supplemental education, and credentials.
"Paid while you train" is the part people find hardest to believe, so it helps to see it written down by a statistical agency. For plumbers, pipefitters and steamfitters, BLS says most workers learn the trade through a 4- or 5-year apprenticeship, and that apprentices typically receive 2,000 hours of paid on-the-job training, plus some technical instruction, each year (BLS, 2025). Two thousand hours a year is close to full-time work; how long an apprenticeship takes explains what sets the length of the whole program. The wage starts low and steps up as you show the skills, and how apprentice pay works walks through a real wage schedule.
Two things this does not mean. It does not mean every trade job is a registered apprenticeship — plenty of people enter trades another way. And it does not mean an apprenticeship is easy to get: programmes are run by employers and sponsors, and the number of openings in your state and your trade in a given year is a local fact, not a national one.
How many people are doing apprenticeships, and is that growing?
Two official counts get quoted, and they measure different things. Reporting them together, with their definitions attached, is the only honest way to answer.
The Congressional Research Service publishes a fiscal-year table of registered apprenticeship activity, sourced to the Department of Labor's "Apprentices by State" dashboard (CRS R45171, updated February 2025). It counts active apprentices — people enrolled during that fiscal year — and completers.
The Government Accountability Office reports a participation figure for a programme year: about 940,000 workers participated in Registered Apprenticeship Programs in FY2024 (GAO, 2025).
| Measure | FY2015 | FY2024 | Source (year) |
|---|---|---|---|
| Active apprentices | 359,788 | 679,960 | CRS R45171, Table 1 (2025) |
| Completers | 48,024 | 111,767 | CRS R45171, Table 1 (2025) |
| Participants in Registered Apprenticeship Programs | not reported here | about 940,000 | GAO-25-107040 (2025) |
The active-apprentice count nearly doubled between FY2015 and FY2024, and completers more than doubled. The GAO participation figure is larger than the CRS active count for the same year because it is a different measure over a different window — not a contradiction, and not a number to average with the other one.
CRS adds a caution worth repeating: do not use that table to work out a completion percentage. Most programmes run several years, so the people completing in a year are mostly not the people who started in it.
What do apprentices and skilled trades earn?
GAO reports that registered apprenticeship completers who exited between April 2022 and March 2023 earned average annual wages of about $80,000 in their first year after exiting, and notes that this was higher than average annual wages of associate's degree holders in BLS data (GAO, 2025).
Read that carefully. It is an average — a mean — for people who completed a programme, in their first year after exit. Means are pulled upward by high earners, and completers are not the same group as everyone who ever started. It is a real, sourced figure about a real group. It is not a salary you can expect.
Medians for specific trades are easier to reason about, because a median is the middle of the range:
| Occupation | Median annual wage (May 2025) | Typical entry-level education | Projected growth 2025–35 | Source |
|---|---|---|---|---|
| Electricians | $63,190 | High school diploma or equivalent | 9% | BLS OOH |
| Plumbers, pipefitters and steamfitters | $63,800 | High school diploma or equivalent | 7% | BLS OOH |
| Heating, air conditioning and refrigeration mechanics and installers | $61,010 | Postsecondary nondegree award | 11% | BLS OOH |
The "typical entry-level education" column matters as much as the wage column. For two of these three trades, BLS states the typical entry point as a high school diploma or equivalent. The third, HVAC, typically expects a postsecondary nondegree award — a certificate, not a degree.
What does college cost?
There are two different college-cost measures in wide use, and mixing them is the most common mistake in this comparison. Published tuition and fees is the sticker price of instruction. Total cost of attendance adds housing, food and other costs. They come from different publishers and, here, from different years.
| Measure | Sector | Amount | Year | Source |
|---|---|---|---|---|
| Average published tuition and fees | Public four-year, in-state | $11,950 (+$340, 2.9%) | 2025-26 | College Board |
| Average published tuition and fees | Public four-year, out-of-state | $31,880 (+$1,060, 3.4%) | 2025-26 | College Board |
| Average published tuition and fees | Private nonprofit four-year | $45,000 (+$1,750, 4.0%) | 2025-26 | College Board |
| Average total cost of attendance, living on campus | Public four-year | $27,100 | 2022–23 | NCES |
| Average total cost of attendance, living on campus | Private nonprofit four-year | $58,600 | 2022–23 | NCES |
Do not add, subtract or annualise across those two blocks. They are two measures, from two years, by two publishers. The College Board figures are published prices before any grant aid; the NCES figures are averages for first-time, full-time undergraduates living on campus in 2022–23. What one particular student pays after aid is a different number again, and neither table can tell you what it is.
The comparison people usually want — four years of college against four years of paid apprenticeship — is not a subtraction problem. One route has a price you pay and the other has a wage you receive, but both also carry hours, risk, and outcomes that vary by person, employer, institution and state.
What do graduates earn, and how many finish?
BLS publishes median usual weekly earnings by education level. The 2025 figures are BLS's annual estimates, and BLS notes they are 11-month averages that exclude October 2025 and are not strictly comparable with annual averages for other years (BLS, 2025). They are also weekly figures — multiplying by 52 to get a headline salary would misstate what the series measures.
| Education level | Median usual weekly earnings (BLS, 2025) |
|---|---|
| High school diploma | $966 |
| Some college, no degree | $1,062 |
| Associate's degree | $1,135 |
| Bachelor's degree | $1,578 |
In the same table, the unemployment rate for high school diploma holders was 4.3% and for bachelor's degree holders 2.8% (BLS, 2025).
The bachelor's row is the one everyone quotes. It also has a condition attached: it describes people who finished. Not everyone does. NCES reports that the six-year graduation rate for first-time, full-time students who began seeking a bachelor's degree at four-year institutions in fall 2014 was 64% overall — 63% at public institutions, 68% at private nonprofits and 29% at private for-profits (NCES, 2020 data).
So "some college, no degree" is not a rare edge case. It is a large group with its own line in the earnings table, at $1,062 a week (BLS, 2025). If you are weighing a degree, the honest version of the question includes: how likely am I to finish this particular programme, at this particular institution?
Costs and benefits of apprenticeship vs college, side by side
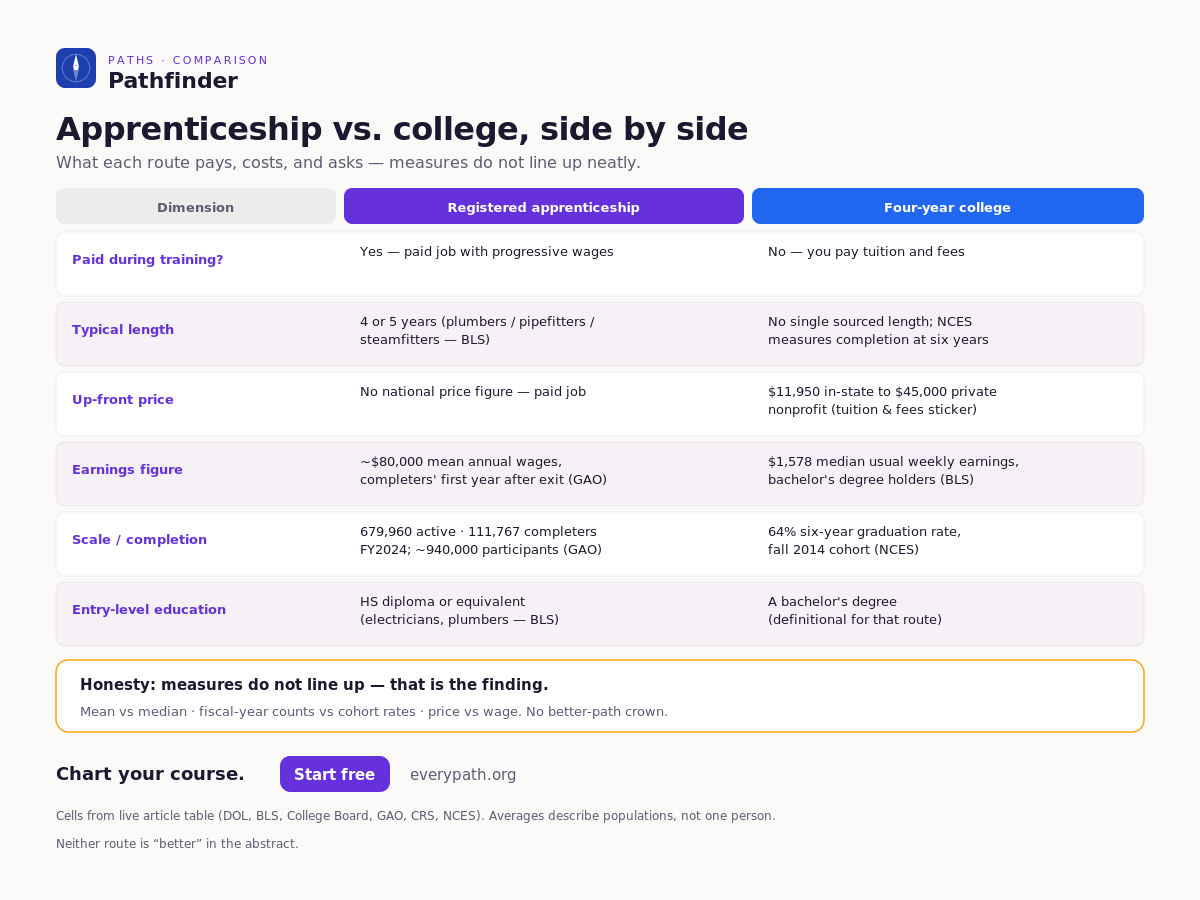
| Dimension | Registered apprenticeship | Four-year college | Source (year) |
|---|---|---|---|
| Paid during training? | Yes — a paid job with progressive wage increases | No — you pay tuition and fees | DOL apprenticeship.gov (accessed 2026-09-11); College Board (2025-26) |
| Typical length | 4 or 5 years for plumbers, pipefitters and steamfitters | No single sourced length here; NCES measures completion at six years | BLS OOH (May 2025); NCES (2020 data) |
| Up-front price | No national price figure applies — it is a paid job | $11,950 in-state to $45,000 private nonprofit, tuition and fees | DOL apprenticeship.gov (accessed 2026-09-11); College Board (2025-26) |
| Earnings figure available | About $80,000 average annual wages, completers' first year after exiting April 2022–March 2023 | $1,578 median usual weekly earnings, bachelor's degree holders | GAO-25-107040 (2025); BLS (2025) |
| Scale and completion | 679,960 active apprentices and 111,767 completers in FY2024; about 940,000 participants in FY2024 | 64% six-year graduation rate, fall 2014 cohort | CRS R45171 (2025); GAO-25-107040 (2025); NCES (2020 data) |
| Typical entry-level education for related jobs | High school diploma or equivalent for electricians and plumbers | A bachelor's degree, by definition | BLS OOH (May 2025) for the trades; the college cell is definitional, not a sourced figure |
Every cell above is a figure from a named publication with a year. Notice how many of them do not line up neatly: a mean against a median, a fiscal-year count against a cohort rate, a price against a wage. That mismatch is the real finding.
What can't these numbers tell you?
They cannot tell you what will happen to you. Averages and medians describe populations. You are one person, in one state, in one trade or one course, at one moment in a labour market.
Four limits are worth naming plainly:
- The two headline earnings figures are different statistics. GAO's $80,000 is a mean annual wage for completers; BLS's $1,578 is a median weekly figure for a much broader group. Put them in one sentence and you have compared two different things.
- National wages hide regional ranges. A trade wage in one metro area can sit a long way from the national median in either direction, and BLS publishes those ranges separately.
- College-cost figures are sticker or average figures. They are not what one student pays after grant aid, and they are not a bill anyone actually receives.
- The education table does not see apprenticeships. BLS states that its education categories reflect only the highest level of educational attainment and do not take into account completion of training programs in the form of apprenticeships and other on-the-job training (BLS, 2025).
This is also how Pathfinder labels its own claims, and the distinction is the same one. A sourced national figure — an official wage, a published tuition average — is grounded for exactly what it says and no further. Anything Pathfinder calculates for you from those figures is modelled: a reasoned estimate, marked as one, not a fact. And neither ever becomes a prediction about you. Pathfinder will never state your chances of getting into a school, in any wording — that is one of the things Pathfinder's AI is built to refuse, along with inventing a deadline or a cost.
We would rather show you a number with its year and its publisher attached, and say plainly what it does not cover, than hand you a confident answer we cannot stand behind.
How do you decide which numbers apply to you?
Turn the national figures into local questions. These are the ones worth asking first:
- Does the trade I am interested in use registered apprenticeships in my state? Sponsors and openings are local. A national count does not tell you what is open near you next year; how to find a registered apprenticeship covers the official search tools.
- What would tuition actually be for me? In-state or out-of-state moves the published figure from $11,950 to $31,880 (College Board, 2025-26), and grant aid changes it again.
- How likely am I to finish the specific programme I am considering? The 64% six-year rate is a national average across institutions that range widely (NCES, 2020 data).
- What does entry look like on each route? BLS names the typical entry-level education for each occupation, and a "high school diploma or equivalent" entry point is a materially different starting line from a degree requirement.
- What is my backup? Choosing a primary path and an explicit backup path beats making one unhedged bet — and these two routes are not mutually exclusive. A community college transfer, for instance, sits between them.
- Am I ready to choose at all? "Still deciding" is a legitimate answer. It is a starting point to plan around, not a failure to have an opinion.
If it helps to know what a tool costs before you start, Pathfinder's what is free and what is not page sets that out, and the free plan needs no card.
Want these numbers applied to your own plan?
Pathfinder builds you a plan for whichever path you pick — or for "still deciding" — and labels every claim in it as grounded, modelled or advisory. It will not invent a deadline, a cost, or your odds of getting in.
Start free — no credit card required.
Frequently asked questions
Do apprentices get paid?
Yes. A registered apprenticeship is a job with a progressive wage schedule (U.S. Department of Labor), and BLS describes plumbing apprenticeships as 2,000 hours of paid on-the-job training a year (BLS, 2025).
Is an apprenticeship better than college?
Neither is better in the abstract. The honest comparison is what each route pays, what it costs and what it asks of you — and the averages in this article describe populations, not one person.
How long does an apprenticeship take?
It varies by trade. BLS says most plumbers, pipefitters and steamfitters learn through a 4- or 5-year apprenticeship (BLS, 2025). Check the length of the specific program you are looking at.
Can you go to college after an apprenticeship?
The two routes are not mutually exclusive. Pathfinder lets you plan a primary path and an explicit backup path rather than forcing a single, unhedged choice.
Do these numbers apply outside the US?
No. Every figure in this article is US federal or US national data. Pathfinder currently ships country packs for the US, the UK, the UAE, India and Singapore.
Sources
- Occupational Outlook Handbook — Electricians — U.S. Bureau of Labor Statistics (2025), accessed 2026-09-11
- Occupational Outlook Handbook — Plumbers, Pipefitters, and Steamfitters — U.S. Bureau of Labor Statistics (2025), accessed 2026-09-11
- Occupational Outlook Handbook — Heating, Air Conditioning, and Refrigeration Mechanics and Installers — U.S. Bureau of Labor Statistics (2025), accessed 2026-09-11
- Registered Apprenticeship: Federal Role and Recent Federal Efforts (R45171) — Congressional Research Service (2025), accessed 2026-09-11
- Apprenticeship: Earn-and-Learn Opportunities Can Benefit Workers and Employers (GAO-25-107040) — U.S. Government Accountability Office (2025), accessed 2026-09-11
- Fast Facts: Tuition costs of colleges and universities — National Center for Education Statistics (2022-23), accessed 2026-09-11
- Trends in College Pricing and Student Aid 2025 — Highlights — College Board (2025-26), accessed 2026-09-11
- Unemployment rates and earnings by educational attainment — U.S. Bureau of Labor Statistics (2025), accessed 2026-09-11
- Registered Apprenticeship Program (employers) — U.S. Department of Labor, accessed 2026-09-11
- Fast Facts: Graduation rates — National Center for Education Statistics (2020), accessed 2026-09-11
Chart your course
Pathfinder builds you a plan for whichever path you pick — or for “still deciding” — and labels every claim in it as grounded, modelled or advisory. It will not invent a deadline, a cost, or your chances of getting in.
Start free No credit card required.
Related reading
- What is a registered apprenticeship? Sourced definition
DOL-registered apprenticeships: paid work + training, with standards. How they differ from informal “apprentice” jobs.
- Trade school vs. college: costs, wages and time
Trade school vs. college with sourced US data: what each costs, what the jobs pay, how long each takes, and what the averages cannot tell you.
- Do apprenticeships count as college credit? When and how
Some registered apprenticeships earn college credit, but never automatically. Where credit comes from, how ACE reviews and state deals work, and what to ask.